
Blog
Patchy Affordability Is Reshaping Housing: Cooling Markets, Hot Spots, and Local Zoning Shifts
7 min read
August 30th, 2026
Why affordability is diverging by metro
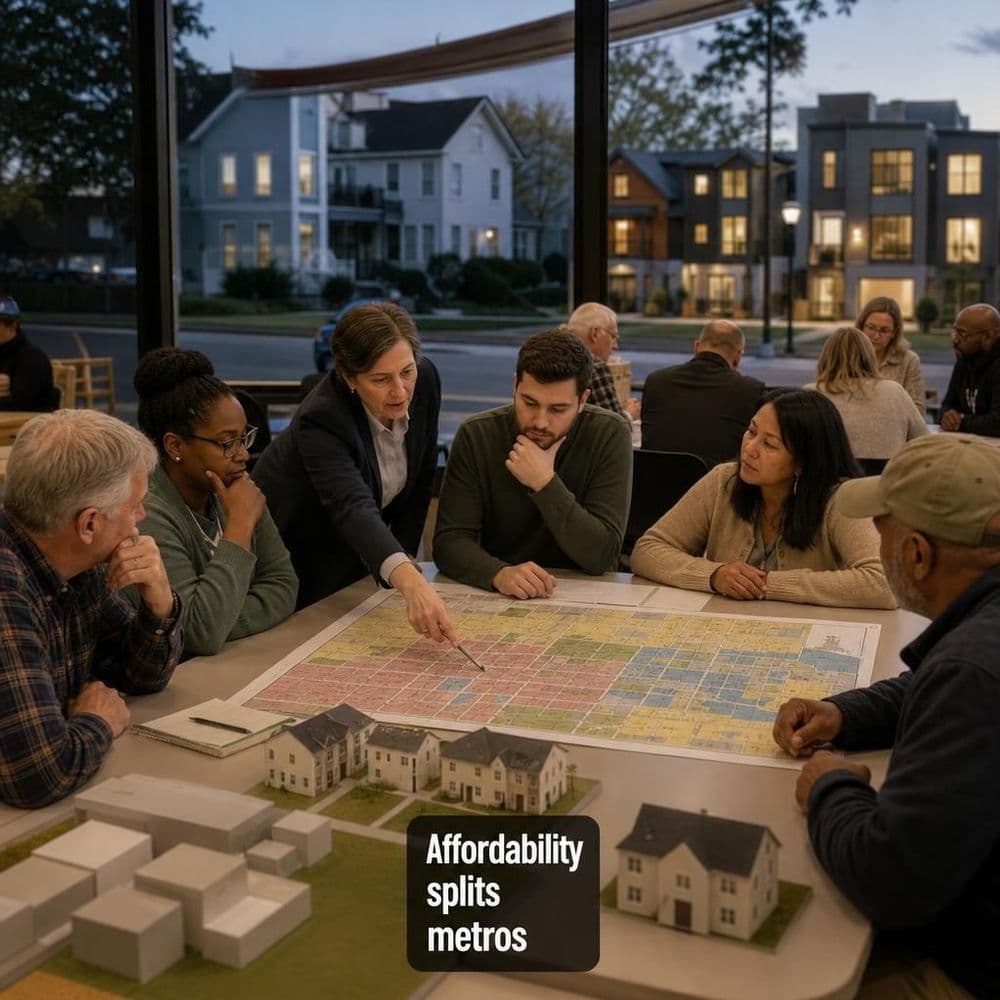
The current affordability story isn’t a single national wave—it’s a set of overlapping local cycles. Austin is still working through a downshift, with one report noting home prices fell 1.4% year over year in July. But the same coverage stresses that lower prices don’t automatically mean lower overall housing costs for residents, especially when taxes and fees move independently. [cbsaustin.com]
Meanwhile, some Midwest markets remain comparatively “cheap” but are still appreciating quickly. A Homes.com analysis highlighted by Cleveland Magazine says Greater Cleveland’s median sale price rose 4.1% year over year in July versus 2.6% nationally, with a July median of $279,000 (vs $400,000 nationally). [clevelandmagazine.com]
Demand is going cross-market
As affordability gaps widen, shoppers are increasingly willing to look outside their home metro. Realtor.com’s Cross Market Demand Report (as summarized by RISMedia) found that three in five home views from the 100 largest metros went to out-of-market listings in Q2 2026, and that out-of-market share was 60.1% (vs 48.2% in Q2 2019). [rismedia.com]
That helps explain why lower-cost metros can stay competitive even when rates are high: they’re pulling demand from more expensive places, while also giving local residents a reason to stay put.
Zoning and product type: manufactured housing in Texas
One of the most immediate “affordability levers” is expanding what can be built by right. Realtor.com reports that Texas’ SB 785 requires hundreds of cities to allow manufactured homes, but local zoning can still narrow where they’re permitted. The same article cites a National Zoning Atlas analysis finding 33% of cities don’t explicitly allow manufactured housing and another 11% require a special permit or public hearing. [realtor.com]
For entry-level buyers, those zoning details can be the difference between a real supply increase versus a symbolic policy win.
Public housing redevelopment and mixed-income rebuilds
Local housing authorities are also leaning into redevelopment to add units and modernize aging sites. In Philadelphia, the housing authority plans 85 affordable homes in Strawberry Mansion: 55 rentals (including a 36-unit apartment building and 19 townhomes) plus 30 for-sale single-family homes via the city’s Turn the Key program. The rentals are described as fully subsidized, with tenants paying no more than 30% of monthly income toward rent. [northeasttimes.com]
In Jersey City, a milestone approval advanced a plan to redevelop Holland Gardens (originally built in 1944) into a 753-home mixed-income community that also includes retail and a new library, with the project describing resident return without displacement. [jerseydigs.com]
Adaptive reuse: turning shuttered buildings into rentals
Adaptive reuse can add supply in places where ground-up building is slow, expensive, or constrained. The Hartford Business Journal reports an example in Connecticut: a shuttered Wallingford nursing home was purchased for $4.2 million with plans to convert it into 66 affordable apartments. [hartfordbusiness.com]
But reuse is rarely simple. An Associated Press report on a major Manhattan office-to-apartment conversion underscored how engineering complexity can halt projects unexpectedly—one reason these deals can take longer and cost more than initial pro formas assume. [apnews.com]
What to watch next (practical checklist)
- **Rates and payment math:** Even small mortgage-rate moves can dominate affordability. Freddie Mac’s weekly PMMS showed the average 30-year fixed rate at 6.66% as of 2026-08-27. [freddiemac.com]
- **Local zoning text (not headlines):** Look for map updates, by-right permissions, minimum lot sizes, and design standards that can effectively block “allowed” housing types.
- **Redevelopment deliverability:** Track timelines, financing layers, and tenant relocation/return plans for public-housing rebuilds.
- **Out-of-market demand:** Monitor where online views and inbound migration are coming from; it’s a leading indicator for pricing pressure in lower-cost metros. [rismedia.com]
Comments